 indiely
Data & Benchmarks · FIELD NOTES
How to Read Your Steamworks Traffic Report (Without Panicking)
A plain-English guide to the Steamworks traffic report: what impressions, visits and CTR really measure, and how to turn them into weekly decisions.
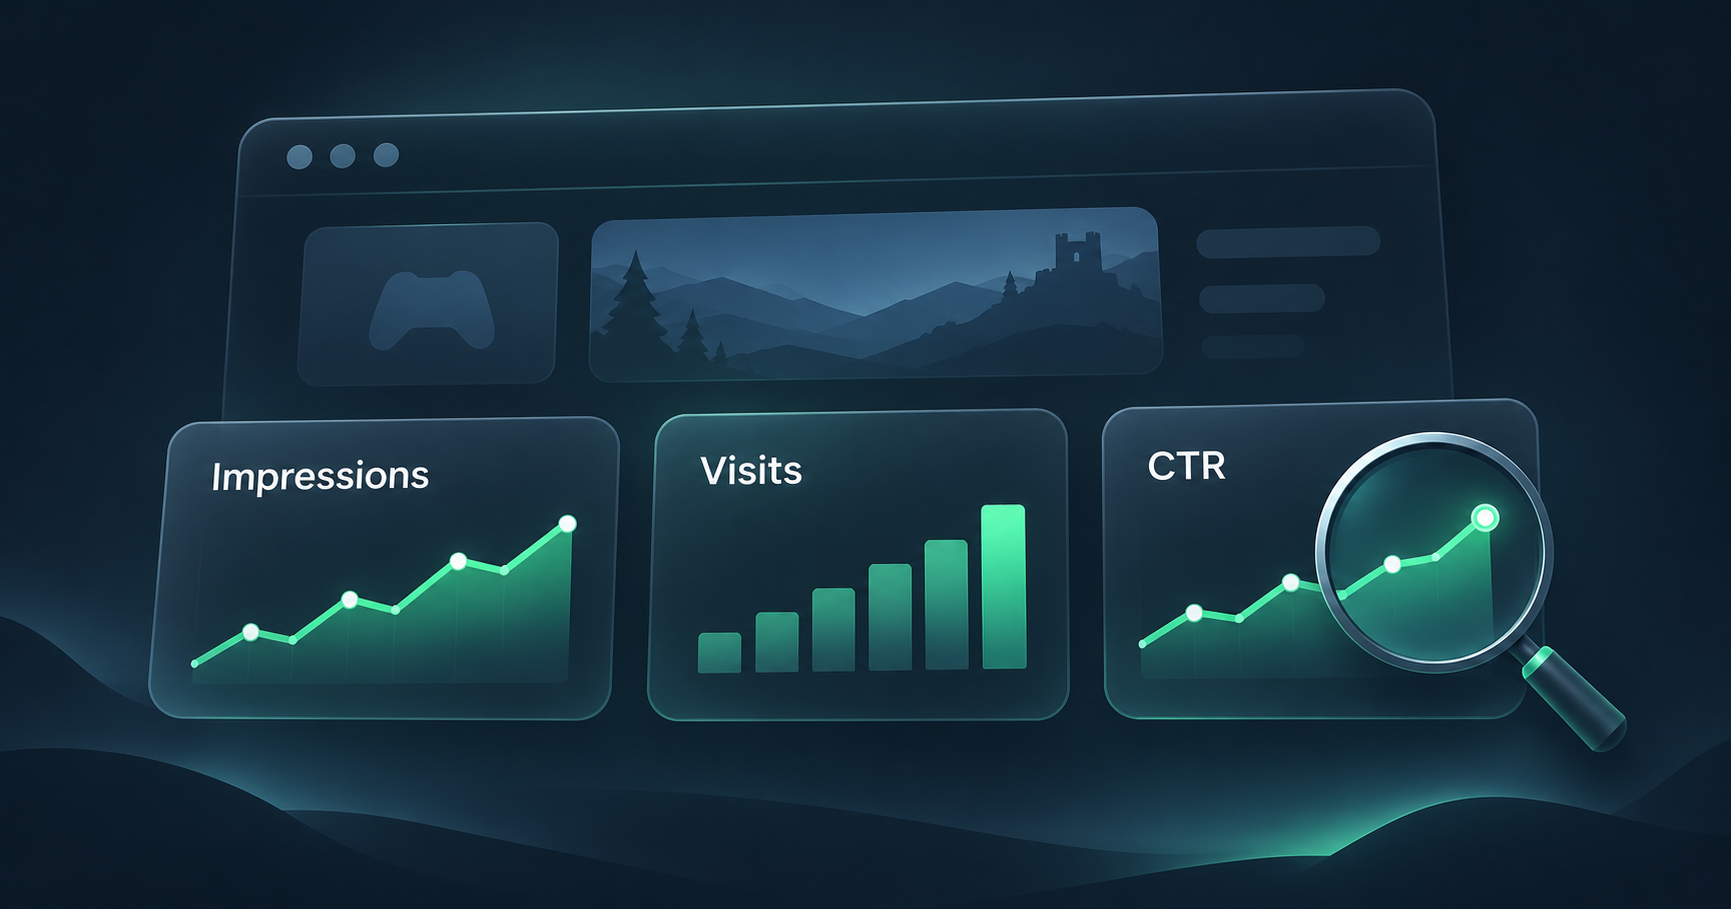
The first time you open your Steamworks traffic report, the numbers can look alarming. Tens of thousands of impressions, a few hundred visits, a click-through rate under 2%. Is that bad? Is Steam hiding your game?
Usually, no. This guide explains what each number in the report actually measures, which ones deserve your attention, and a simple weekly routine for turning the report into decisions about your capsule, your store page and your marketing.
Where to find the Steamworks traffic report
Open your game's App Landing Page in Steamworks, go to Marketing Tools & Data, click Marketing & Visibility and choose the Store & Steam Platform Traffic Breakdown tab. You can also switch the source to your partner account to see all your games together.
Wishlist numbers live somewhere else: in the Wishlists section of each app in the Sales & Activation Reports portal. Valve updates that data daily with a one-day lag, so "today" will always look empty.
The three numbers that matter: impressions, visits and click-through rate
Valve's traffic reporting documentation defines the core metrics like this:
| Metric | Valve's definition | How to read it |
|---|---|---|
| Impressions | Counted "when your game brand is displayed on screen to a player" | Valve notes this "doesn't guarantee the player has seen your game". Treat it as reach, not attention |
| Visits | "Unique page loads of your product's store page" | The real audience your store page gets to persuade |
| Click-through rate | "The percentage of impressions that result in visits to the store page" | How well your capsule and title earn a click in each placement |
Two details explain many confusing rows. First, some platform impressions, such as a friend-in-game notification, don't link to your store page, so they show impressions without a measurable click-through rate. Second, since 23 March 2021 the impression and visit reports exclude users who opted out of the relevant cookies, so the numbers undercount real activity.
Where your traffic comes from
The breakdown lists the placements that showed your game and sent visits to your page. Valve's examples include store recommendation pages, discount and update sections, Steam Community content and friend activity, plus a Direct Navigation series and Steam Platform Traffic (non-store traffic). Visits from outside Steam, such as social media, press and newsletters, appear as external traffic.
It helps to sort the rows into two groups when you read them:
- Traffic Steam gives you: recommendations, search, tag pages, sale and festival placements. Here, impressions are largely decided by Steam, and your job is to win the click with a strong capsule.
- Traffic you bring: your social posts, trailers, creator videos, press and email. Here, visits depend on your marketing, and your job is to convert those visitors once they arrive.
A 15-minute weekly routine
You don't need to check the report every day. Once a week is enough to spot real changes without reacting to noise.
- Write down three numbers. Weekly visits, weekly wishlist additions (from the Wishlists section) and your overall click-through rate. A simple spreadsheet with one row per week is enough.
- Find your highest-impression placement with a weak click-through rate. If Steam is showing your game a lot but few people click, the capsule and title are the bottleneck. Check the capsule on a realistic shelf with the Steam Shelf Simulator, or compare two versions with a free capsule A/B test.
- Compare visits with wishlist additions. If visits grow but wishlists don't, people are reaching the page and leaving. Look at the short description, the first screenshots and the trailer. The free Steam Page Analyzer is a quick first pass.
- Note what you did that week. A festival, a trailer, a creator video, a sale. Without this log, a spike next month will be impossible to explain.
Worked example: reading one week of data
The numbers below are a hypothetical example, not a benchmark. They show how to reason about a report, step by step.
| Metric | This week | Last week |
|---|---|---|
| Impressions | 48,000 | 21,000 |
| Visits | 620 | 540 |
| Click-through rate | 1.3% | 2.6% |
| Wishlist additions | 71 | 58 |
At first glance, the click-through rate halved, which looks like a problem. But impressions more than doubled, visits went up by about 15% and wishlists rose too. The likely story: Steam showed the game in a new, broad placement (a sale or festival page, for example) where far more people scroll past. The extra impressions were lower quality, so the average rate fell, while the total audience grew.
The useful question is not "why did my click-through rate drop?" but "which placement brought the new impressions, and is its click-through rate low compared with my other placements?" Open the breakdown and check that row on its own.
The visit-to-wishlist ratio is also worth tracking: 71 wishlists from 620 visits is about 11.5%, versus about 10.7% (58 from 540) the week before. The page converts about as well as before, so the store page itself isn't the issue this week.
Track your own marketing with UTM links
The traffic report tells you that external visits happened, but not which tweet or video caused them. For that, Steam supports UTM links. According to Valve's UTM analytics documentation:
- The link must point to your app page or a sale page and include
utm_sourceorutm_campaign. You can also useutm_medium,utm_contentandutm_term. - Steam reports Total Visits, Trusted Visits (without bots and search crawlers) and Tracked Visits (logged-in users), plus wishlists, purchases and activations from tracked visits.
- A conversion counts if it happens within 72 hours of the click. Conversions are finalized four days after the visit.
- Actions taken in a different browser, device or app usually can't be linked to the click. Social media in-app browsers are a common example, so UTM numbers undercount.
A link for a Reddit post could look like this: https://store.steampowered.com/app/YOUR_APP_ID/?utm_source=reddit&utm_campaign=devlog_03. Use one clear name per post or channel, and you'll find the report under the UTM Analytics tab in Marketing & Visibility.
Common panic moments, explained
"My impressions jumped, but my click-through rate crashed"
This usually means Steam added a broad placement. Check whether total visits went up. If they did, the new exposure helped, even at a lower rate.
"My UTM numbers don't match the traffic report"
Valve says they can differ. Cookie opt-outs, cross-device behavior and the different ways each report counts visits all play a part. Use UTM data to compare your own campaigns with each other, not to reconcile totals.
"Today shows zero wishlists"
Wishlist data arrives with a one-day lag. Check again tomorrow before drawing conclusions.
"My conversion rate is low, so Steam will bury my game"
Valve says neither store traffic nor visitor conversion rate is a visibility factor. What does matter, according to Valve, includes purchases and play, your tags, the languages you support and keeping reviews at Mixed (40%) or above. A weak conversion rate still costs you wishlists, so it's worth fixing, but it isn't a hidden penalty.
Planning around a festival? Our Steam Next Fest prep timeline shows when to start logging your numbers, and how many wishlists you need before launch explains what those wishlists can turn into.
Steamworks traffic report FAQ
What is a good click-through rate on Steam?
Valve doesn't publish an official benchmark, and rates differ a lot between placements. Compare each placement with its own history and with your other placements instead of using a single target number.
Does store page traffic affect Steam's algorithm?
No. Valve's visibility documentation says store page traffic and the conversion rate of visitors are not factors in algorithmic visibility. Purchases and play, tags, supported languages and review score (above Mixed) do matter.
Why are my Steam impressions high but visits low?
Impressions count every time your game appears on screen, including in broad placements where most people scroll past. Find the placements with the most impressions and check whether their click-through rate is low compared with your others. If it is, test your capsule.
Can I use Google Analytics on my Steam store page?
No. Valve states that Steam no longer supports Google Analytics. Use the Store & Steam Platform Traffic Breakdown and UTM analytics in Steamworks.
Sources
More from the Journal

How to Write a Steam Short Description That Makes Players Scroll
Valve rules, a simple formula and before-and-after examples for writing a Steam short description that tells players what they will actually do.
Read the article
How to Choose Steam Tags for Your Indie Game (and Order Them Right)
How Steam tags work, how to choose and order your top 20, and how to check them against similar games. Based on Valve docs, with a worked example.
Read the article
Steam Next Fest Prep Timeline: What to Do From 8 Weeks Out to the Day After
A week-by-week plan for Steam Next Fest February 2027: key dates, registration, demo review, Press Preview and what to do after the festival ends.
Read the article